On this page, you can see the latest analysis created in Microsoft Power BI with various data sources Please click on the below picture to find out more about each dashboard. Enjoy Exploring!
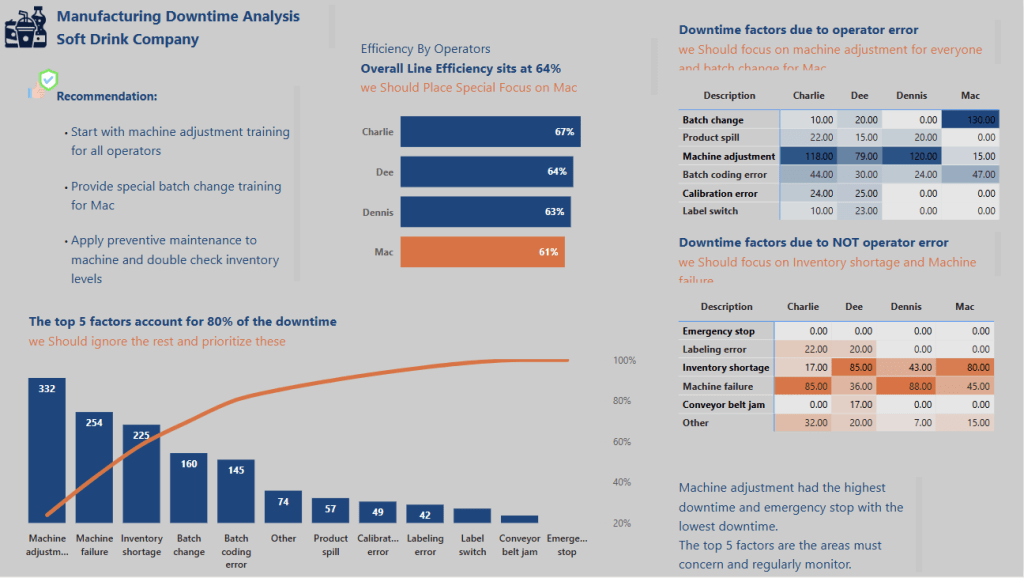
Manufacturing Downtime Analysis
- CSV File
- Microsoft Power BI
- Power Query
- DAX Formulas

The Moder Museum of Art (MoMA)
- CSV File
- Microsoft Power BI
- Power Query
- DAX Formulas
- CSV File
- Microsoft Power BI
- Power Query
- DAX Formulas
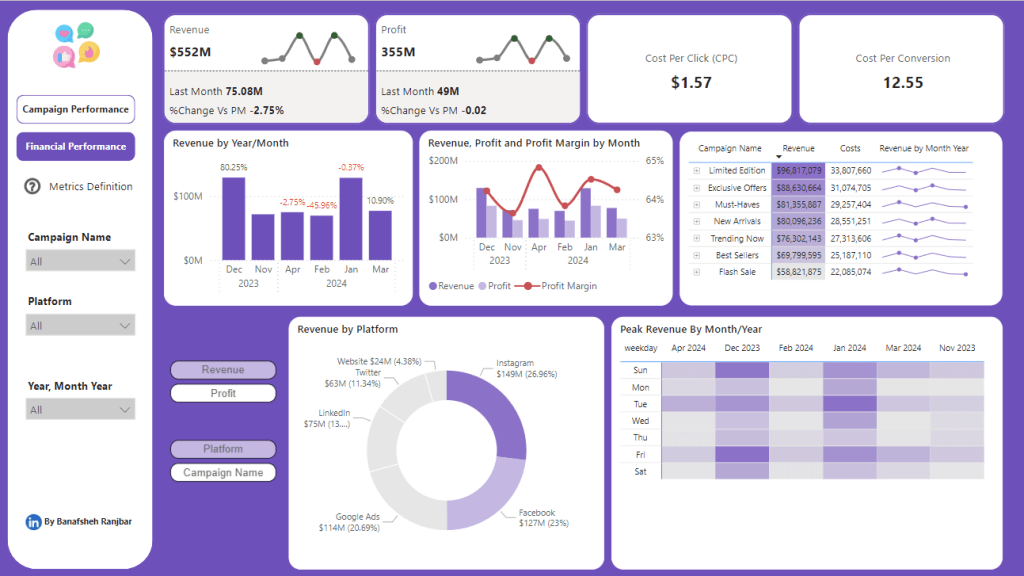
Marketing Campaign Performance
- CSV File
- Microsoft Power BI
- Power Query
- DAX Formulas
- Excel File
- Microsoft Power BI
- Power Query
- DAX Formulas
- Excel Files
- Microsoft Power BI
- Power Query
- DAX Formulas
- Excel Files
- Microsoft Power BI
- Power Query
- DAX Formulas
- CSV File
- Microsoft Power BI
- Power Query
- DAX Formulas
- Excel Files
- Microsoft Power BI
- Power Query
- DAX Formulas
- Excel Files
- Microsoft Power BI
- Power Query
- DAX Formulas
- Excel File
- Power BI
- Power Query
- DAX Formulas
- SQL Database
- Microsoft Power BI
- Microsoft SQL Server Integration Services(SSIS)
- DAX Formulas
- Excel Files
- Microsoft Power BI
- Power Query
- DAX Formulas