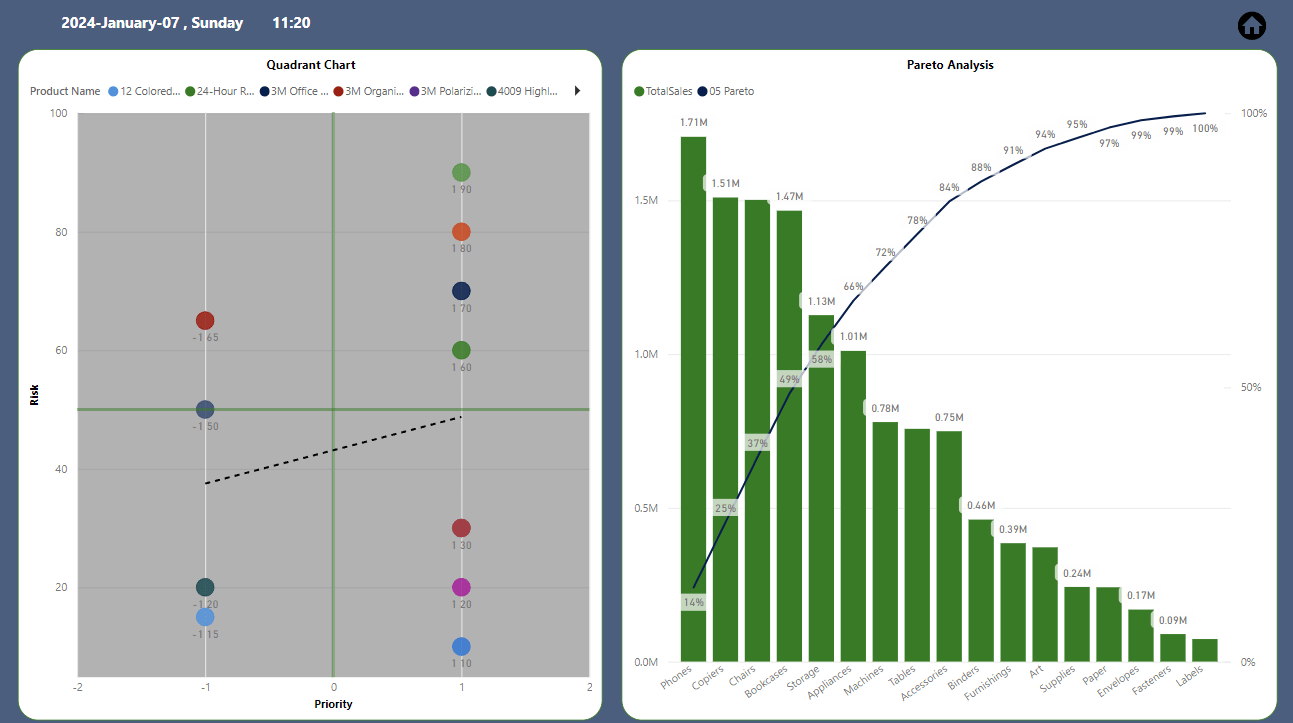
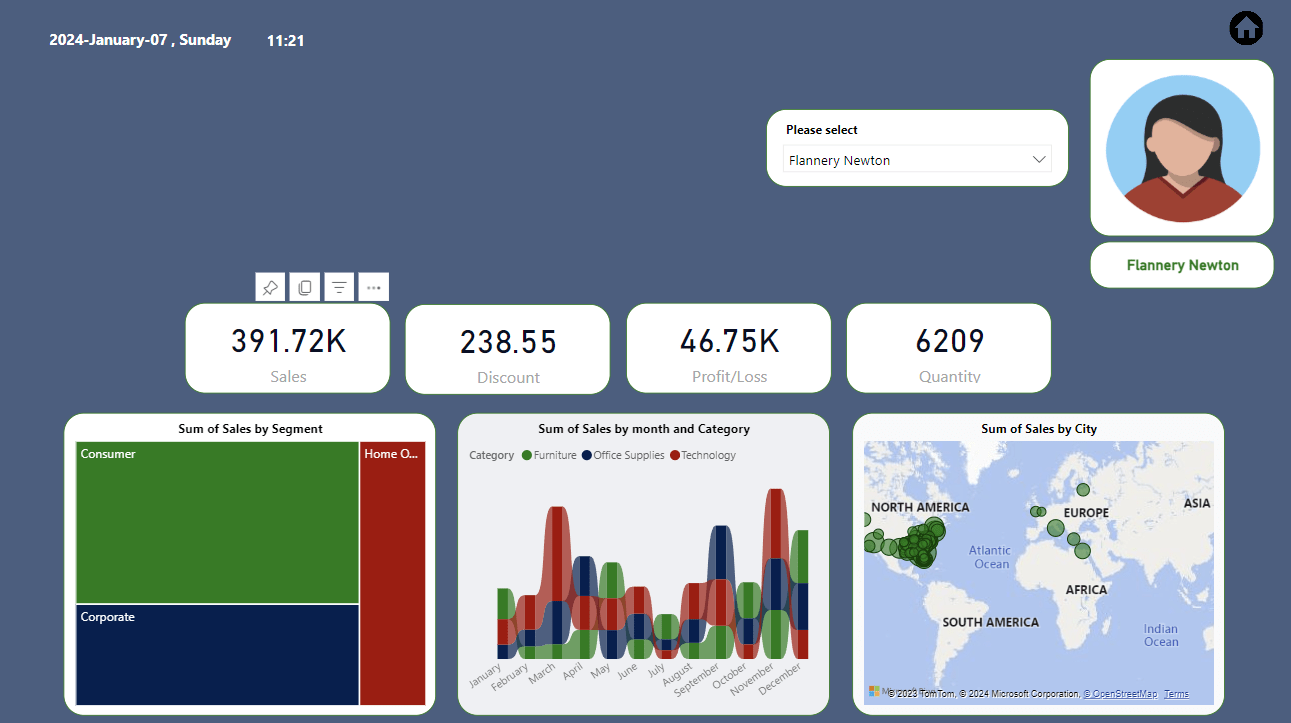
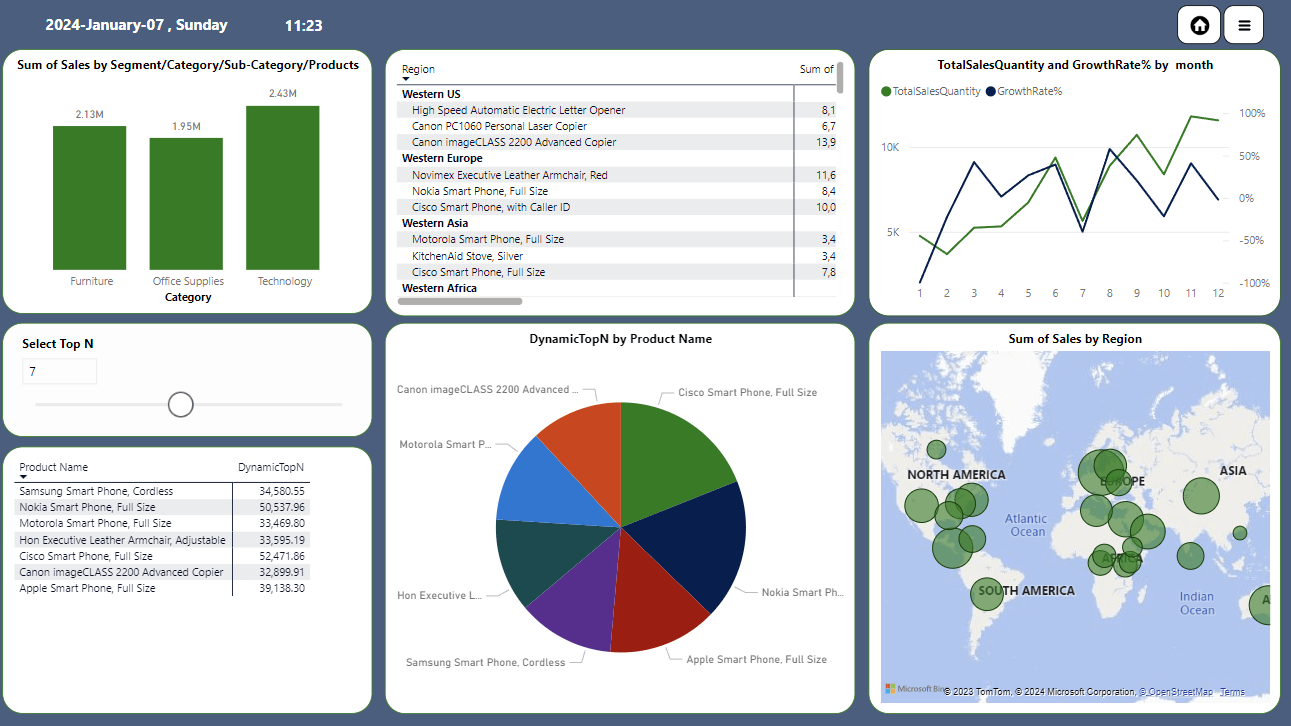
This document provides a comprehensive overview of the Microsoft Power BI dashboard. This dashboard aims to analyze sales performance for the Global Superstore 2016 dataset. The dashboard is designed to offer a comprehensive view of sales and sales metrics through interactive visualizations. The dashboard is organized into sections sales analysis, person analysis, and chart analysis each focusing on a specific aspect of the data.
I encourage users to explore the visualizations and share feedback for continuous improvement.


