We’re thrilled to present our latest creation – a Microsoft Power BI solution that brings you a cutting-edge Apple Stock Price Dashboard. This dynamic dashboard goes beyond the basics, incorporating dividends and investment profit reports for a comprehensive financial overview.
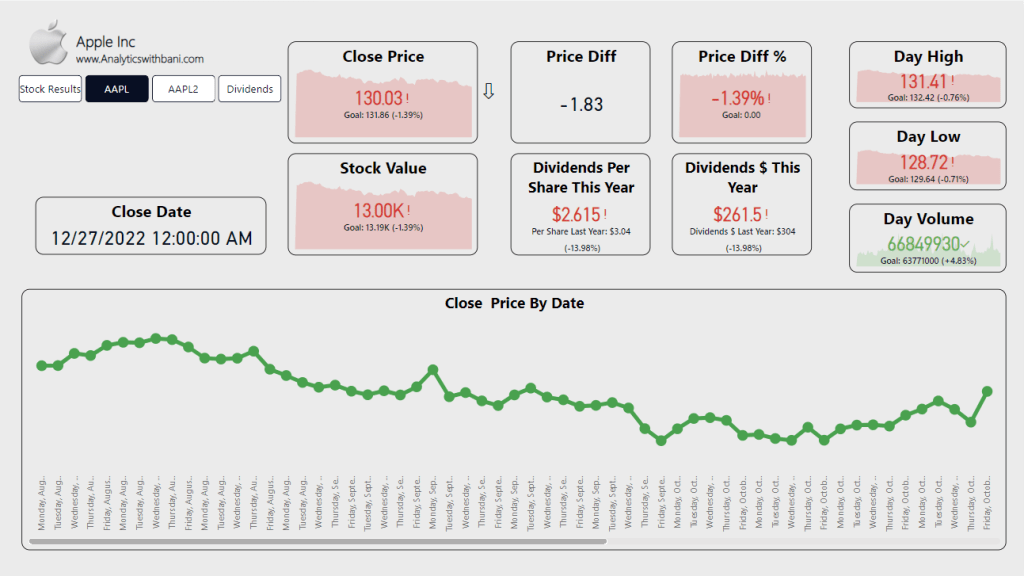
Our dashboard is powered by a meticulously curated dataset obtained from Kaggle.com. Kaggle is a treasure trove for data enthusiasts, and we’ve harnessed its resources to bring you accurate and reliable financial data. The Microsoft Power BI platform allowed us to create a visually appealing and user-friendly interface. The seamless integration of data visualizations ensures that even complex financial information is presented in an easily understandable format.