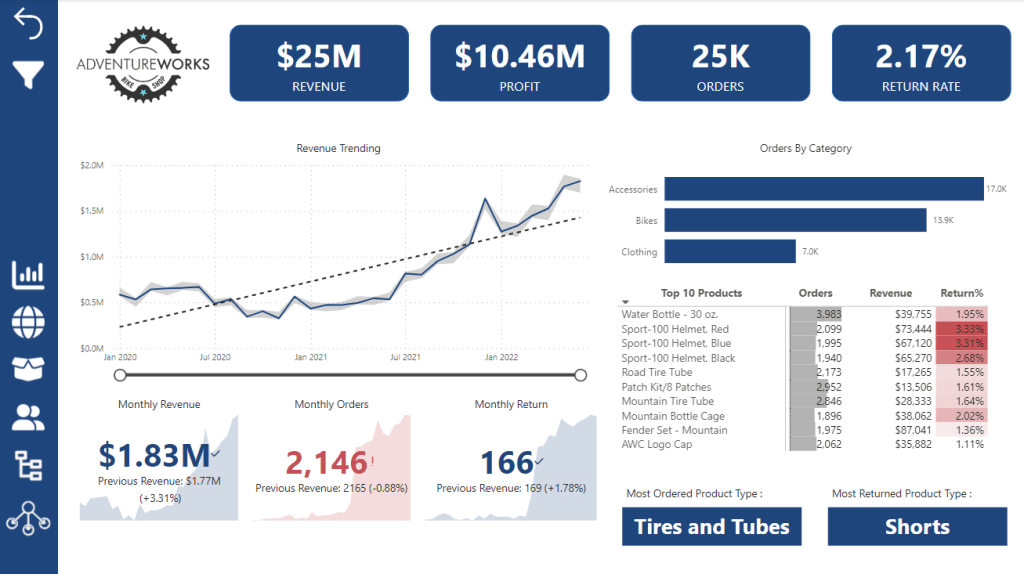
Let’s delve into the fascinating world of the Power BI dashboard featuring the Adventure Works dataset and its latest AI features.
- Contents: The dataset comprises seven distinct tables or tabs:
- Sales: A fact or numeric table.
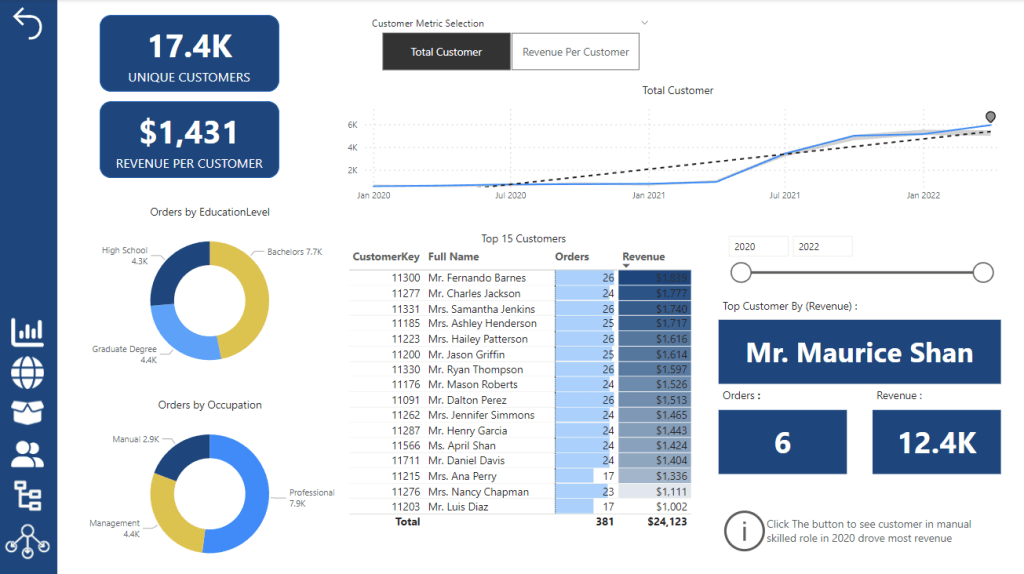
- Product, Customer, Sales Order, Sales Territory, Reseller, and Calendar Date:
- Source: Microsoft generously provides the AdventureWorks dataset as a freely accessible public database.
ETL Process (Extract-Transform-Load)
The ETL process involves:
The AdventureWorks Dataset
- Extract: Getting the data from various sources.
- Transform: Shaping and cleaning the data.
- Load: Storing it in a suitable format.
- Extract: Getting the data from various sources.
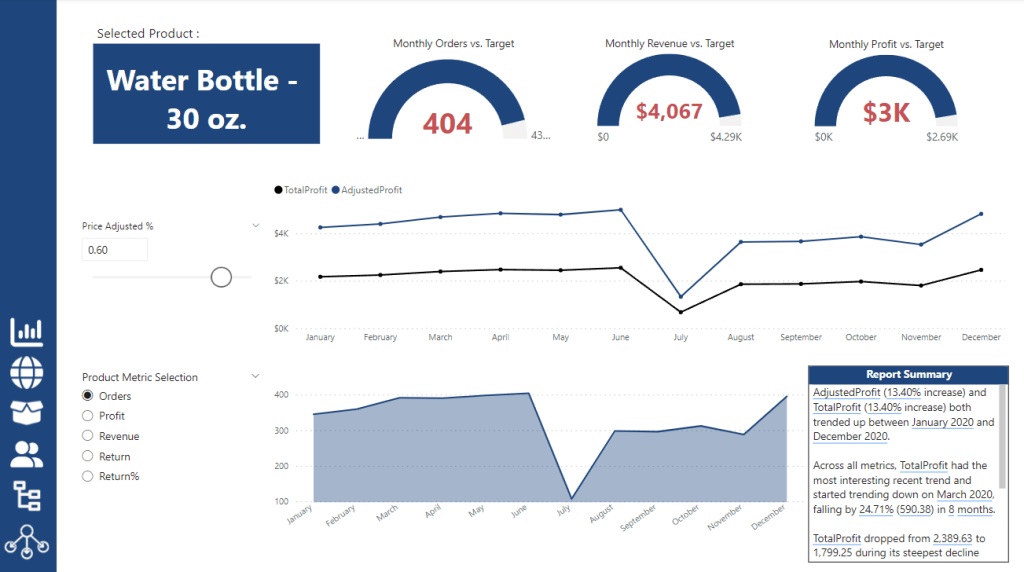
AI Features in the Dashboard
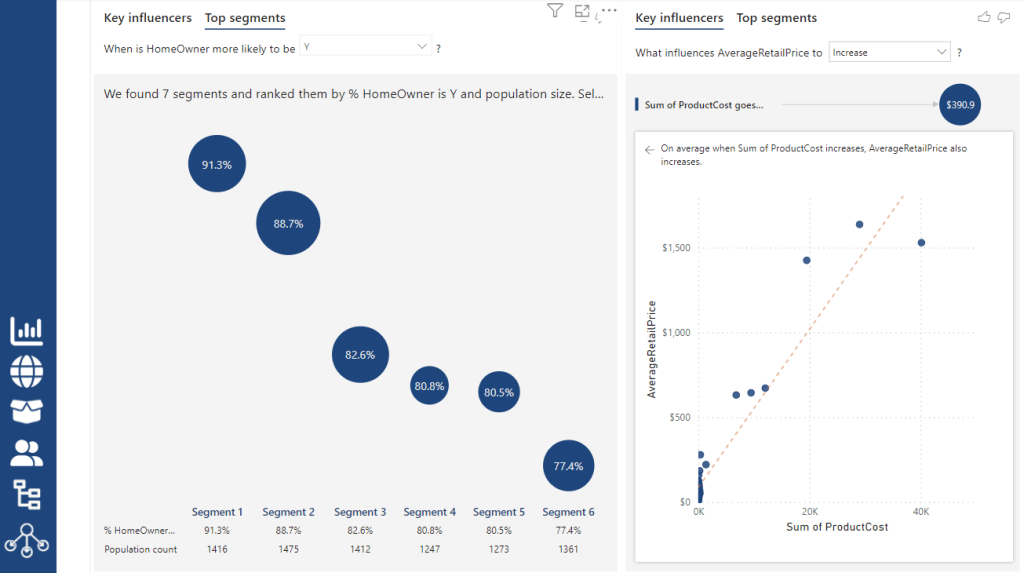
- Key Influencers
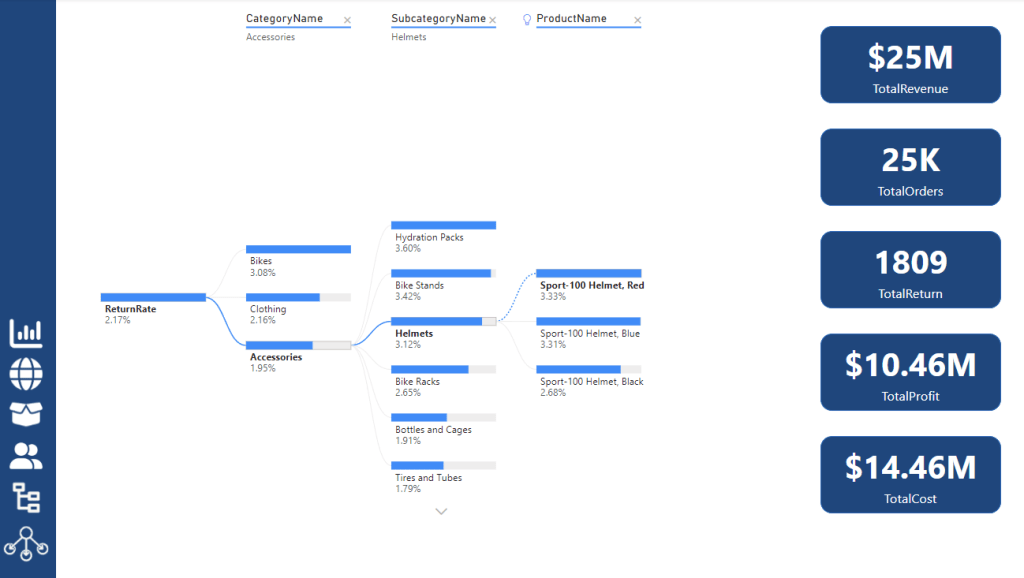
- Decomposition Tree
- Smart Narrative