In this analysis, I dig into the stolen vehicles database to find details on when, which, and where vehicles are most likely to be stolen.
The first objective is to explore the vehicle and date fields in the stolen_vehicles table to identify when vehicles tend to be stolen.
- The number of vehicles stolen each year
- The number of vehicles stolen each month
- The number of vehicles stolen each day of the week
-- WHEN VEHICLES ARE STOLEN
SELECT * FROM [dbo].[stolen_vehicles];
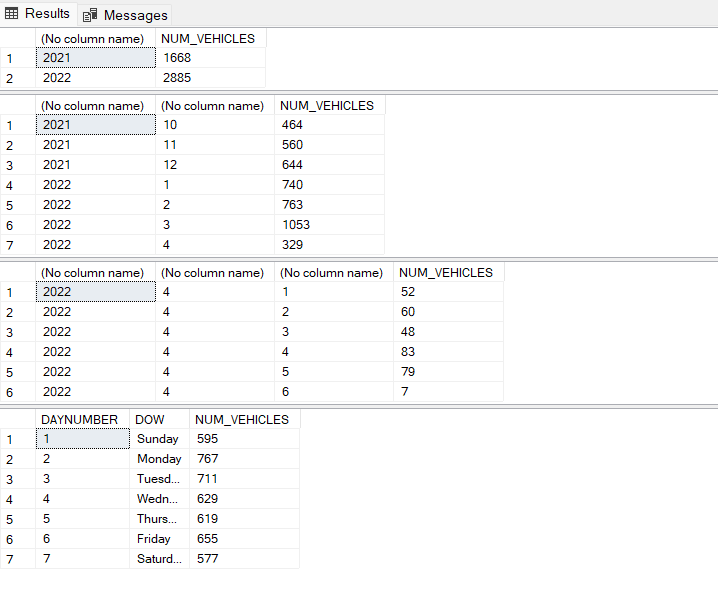
SELECT YEAR(date_stolen) , COUNT(vehicle_id) AS NUM_VEHICLES
FROM [dbo].[stolen_vehicles]
GROUP BY YEAR(date_stolen); -- MORE STOLEN VEHICLES AT 2022
SELECT YEAR(date_stolen), MONTH(date_stolen) , COUNT(vehicle_id) AS NUM_VEHICLES
FROM [dbo].[stolen_vehicles]
GROUP BY YEAR(date_stolen),MONTH(date_stolen)
ORDER BY YEAR(date_stolen),MONTH(date_stolen) ; --DECREASE STOLEN VEHICLES AT MONTH 4 2022
SELECT YEAR(date_stolen), MONTH(date_stolen) ,DAY(date_stolen), COUNT(vehicle_id) AS NUM_VEHICLES
FROM [dbo].[stolen_vehicles]
WHERE MONTH(date_stolen)=4
GROUP BY YEAR(date_stolen) ,MONTH(date_stolen) ,DAY(date_stolen)
ORDER BY YEAR(date_stolen),MONTH(date_stolen),DAY(date_stolen); -- APRIL 4 STOLEN VEHICLES ARE 83
SELECT DATEPART(WEEKDAY,(date_stolen)) AS DAYNUMBER , DATENAME(WEEKDAY,(date_stolen)) AS DOW , COUNT(vehicle_id) AS NUM_VEHICLES
FROM [dbo].[stolen_vehicles]
GROUP BY DATEPART(WEEKDAY,(date_stolen)),DATENAME(WEEKDAY,(date_stolen))
ORDER BY DATEPART(WEEKDAY,(date_stolen)); --MONDAY MOST VEHICLES WERE STOLEN The second objective is to explore the vehicle type, age, luxury vs standard, and color fields in the stolen_vehicles table to identify which vehicles are most likely to be stolen.
- The vehicle types that are most often and least often stolen
- For each vehicle type, find the average age of the cars that are stolen
- For each vehicle type, find the percent of vehicles stolen that are luxury versus standard
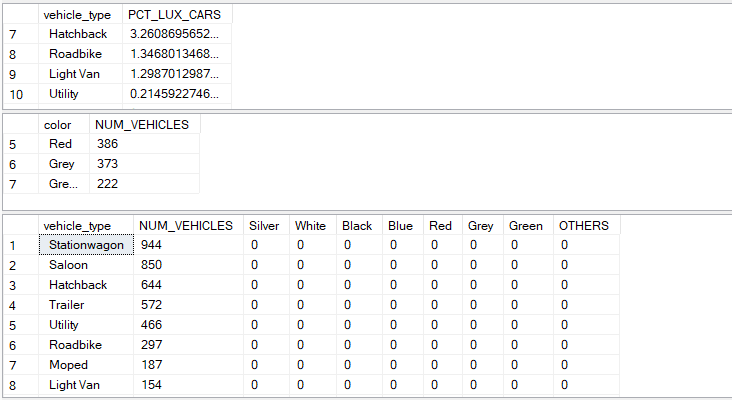
- Create a table where the rows represent the top 10 vehicle types, the columns represent the top 7 vehicle colors (plus 1 column for all other colors) and the values are the number of vehicles stolen
-- WHICH VEHICLES ARE STOLEN
SELECT * FROM [dbo].[stolen_vehicles];
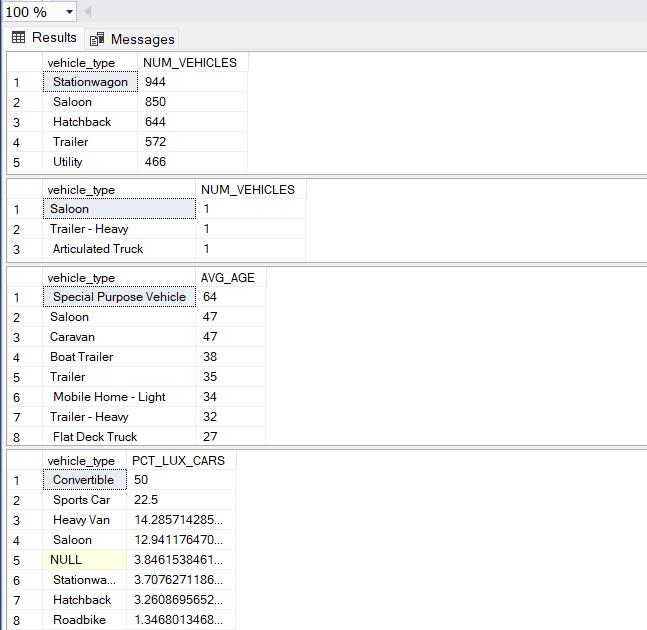
SELECT TOP 5 vehicle_type,COUNT(vehicle_id) AS NUM_VEHICLES
FROM [dbo].[stolen_vehicles]
GROUP BY vehicle_type
ORDER BY NUM_VEHICLES DESC ; --STATIONWAGON MOST OFTEN STOLEN VEHICLE TYPE
SELECT TOP 5 vehicle_type,COUNT(vehicle_id) AS NUM_VEHICLES
FROM [dbo].[stolen_vehicles]
GROUP BY vehicle_type
ORDER BY NUM_VEHICLES ; -- LEAST OFTEN VEHICLES TYPE STOLEN
SELECT vehicle_type,AVG(YEAR(date_stolen) - model_year) AS AVG_AGE
FROM [dbo].[stolen_vehicles]
GROUP BY vehicle_type
ORDER BY AVG_AGE DESC;
WITH LUX_STAN AS (SELECT vehicle_type, CASE WHEN make_type='Luxury' THEN 1 ELSE 0 END AS LUXURY , 1 AS ALL_CARS
FROM [dbo].[stolen_vehicles] AS SV
LEFT JOIN [dbo].[make_details] AS MD
ON SV.make_id = MD.make_id)
SELECT vehicle_type, SUM(CAST(LUXURY AS FLOAT)) / SUM(ALL_CARS) * 100 AS PCT_LUX_CARS
FROM LUX_STAN
GROUP BY vehicle_type
ORDER BY PCT_LUX_CARS DESC ; --CONVERTIBLE AND SPORT CAR ARE THE LUXURY CARS THAT STOLEN MOST
SELECT TOP 7 color , COUNT(vehicle_id) AS NUM_VEHICLES
FROM [dbo].[stolen_vehicles]
GROUP BY color
ORDER BY NUM_VEHICLES DESC;
/*
Silver 1269
White 931
Black 585
Blue 510
Red 386
Grey 373
Green 222 */
SELECT vehicle_type , COUNT(vehicle_id) AS NUM_VEHICLES,
SUM(CASE WHEN color = 'Silver' THEN 1 ELSE 0 END) AS Silver ,
SUM(CASE WHEN color = 'White' THEN 1 ELSE 0 END )AS White,
SUM(CASE WHEN color = 'Black' THEN 1 ELSE 0 END) AS Black,
SUM(CASE WHEN color = 'Blue' THEN 1 ELSE 0 END) AS Blue,
SUM(CASE WHEN color = 'Red' THEN 1 ELSE 0 END) AS Red,
SUM(CASE WHEN color = 'Grey' THEN 1 ELSE 0 END) AS Grey,
SUM(CASE WHEN color = 'Green' THEN 1 ELSE 0 END )AS Green,
SUM(CASE WHEN color IN ('Gold','Brown','Yellow','Orange','Purple','Cream','Pink') THEN 1 ELSE 0 END) AS OTHERS
FROM [dbo].[stolen_vehicles]
GROUP BY vehicle_type
ORDER BY NUM_VEHICLES DESC ;The Final objective is to explore the population and density statistics in the regions table to identify where vehicles are getting stolen and visualize the results using a scatter plot and map.
- The number of vehicles that were stolen in each region
- Combine the previous output with the population and density statistics for each region
- Types of vehicles stolen in the three most dense regions differ from the three least dense regions
-- WHERE VEHICLES ARE STOLEN
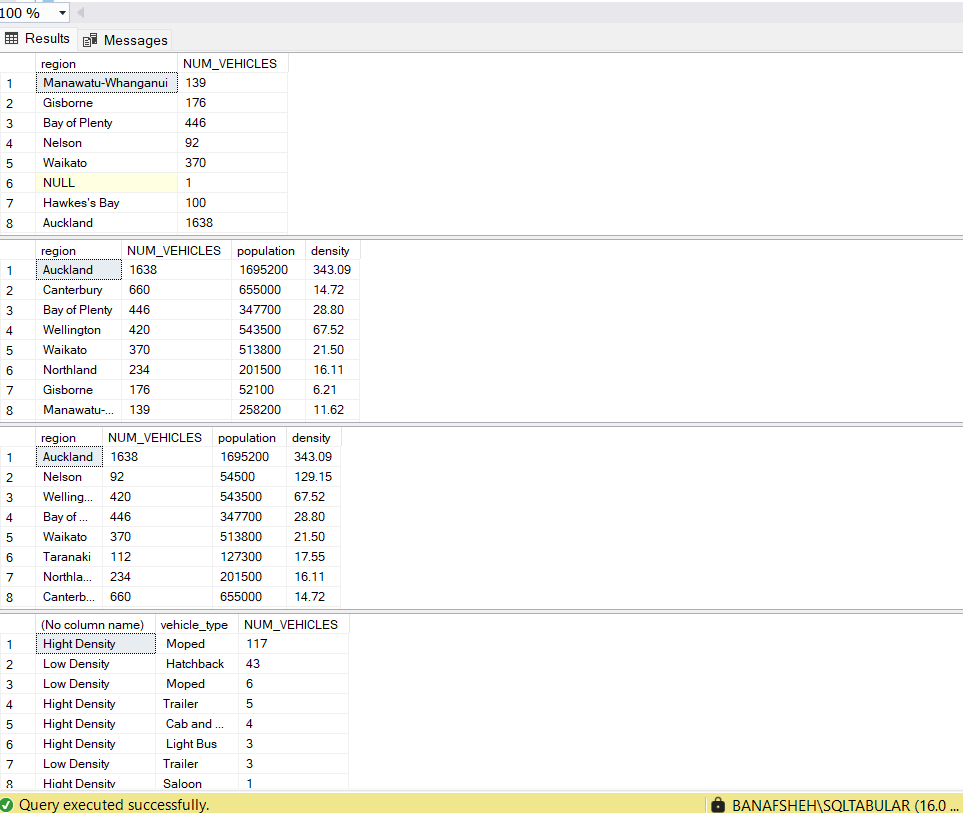
SELECT region , COUNT(vehicle_id) AS NUM_VEHICLES
FROM
[dbo].[stolen_vehicles] SV
LEFT JOIN [dbo].[locations] LV
ON SV.location_id = LV.location_id
GROUP BY region;
SELECT region , COUNT(vehicle_id) AS NUM_VEHICLES , population , density
FROM
[dbo].[stolen_vehicles] SV
LEFT JOIN [dbo].[locations] LV
ON SV.location_id = LV.location_id
GROUP BY region , population , density
ORDER BY NUM_VEHICLES DESC ;
SELECT region , COUNT(vehicle_id) AS NUM_VEHICLES , population , density
FROM
[dbo].[stolen_vehicles] SV
LEFT JOIN [dbo].[locations] LV
ON SV.location_id = LV.location_id
GROUP BY region , population , density
ORDER BY density DESC ;
/* HIGHEST DENSITY
Auckland 1638 1695200 343.09
Nelson 92 54500 129.15
Wellington 420 543500 67.52
LOWEST DENSITY
Otago 139 246000 7.89
Gisborne 176 52100 6.21
Southland 26 102400 3.28 */
(SELECT TOP 5 'Hight Density', SV.vehicle_type , COUNT(SV.vehicle_id) AS NUM_VEHICLES
FROM [dbo].[stolen_vehicles] SV
LEFT JOIN [dbo].[locations] LV
ON SV.location_id = LV.location_id
WHERE LV.region IN ('Auckland','Nelson','Wellington')
GROUP BY SV.vehicle_type
)
UNION
(SELECT TOP 5 'Low Density', SV.vehicle_type , COUNT(SV.vehicle_id) AS NUM_VEHICLES
FROM [dbo].[stolen_vehicles] SV
LEFT JOIN [dbo].[locations] LV
ON SV.location_id = LV.location_id
WHERE LV.region IN ('Otago','Gisborne','Southland')
GROUP BY SV.vehicle_type
)
ORDER BY NUM_VEHICLES DESC;