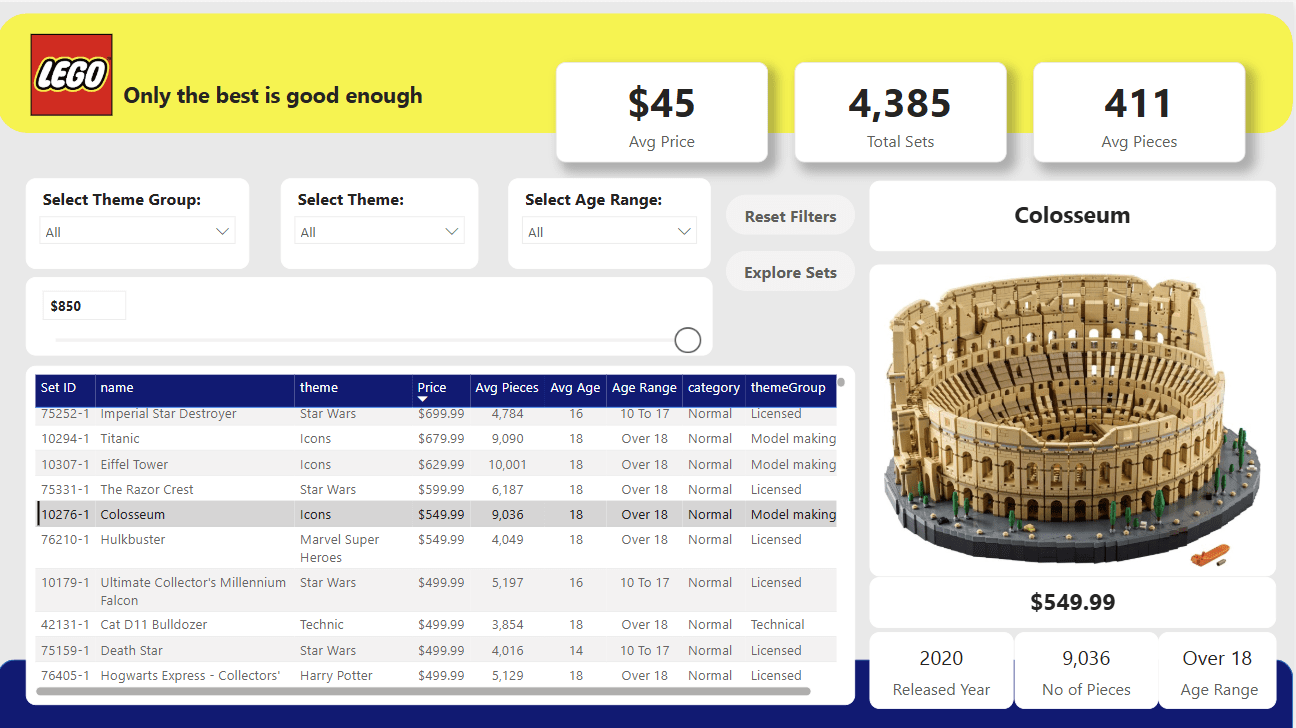
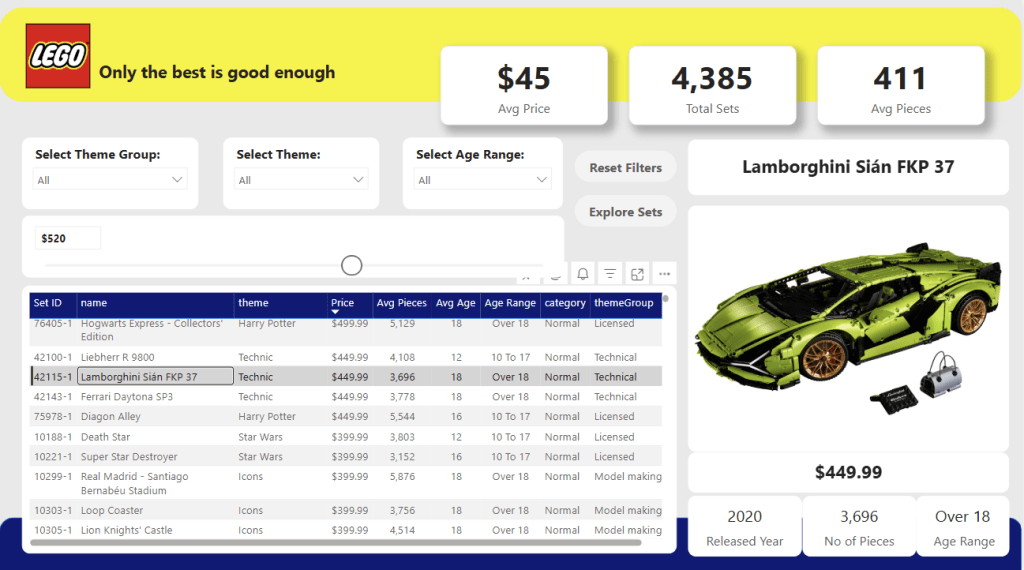
The dashboard is to be built as an interactive tool that you can use to quickly explore all LEGO sets and narrow down the options based on specific criteria.
- Load and prepare the data (CSV Files) for analysis
- Design the layout and visuals
- Define various Measures using DAX Formulas
- Add Interactive visual
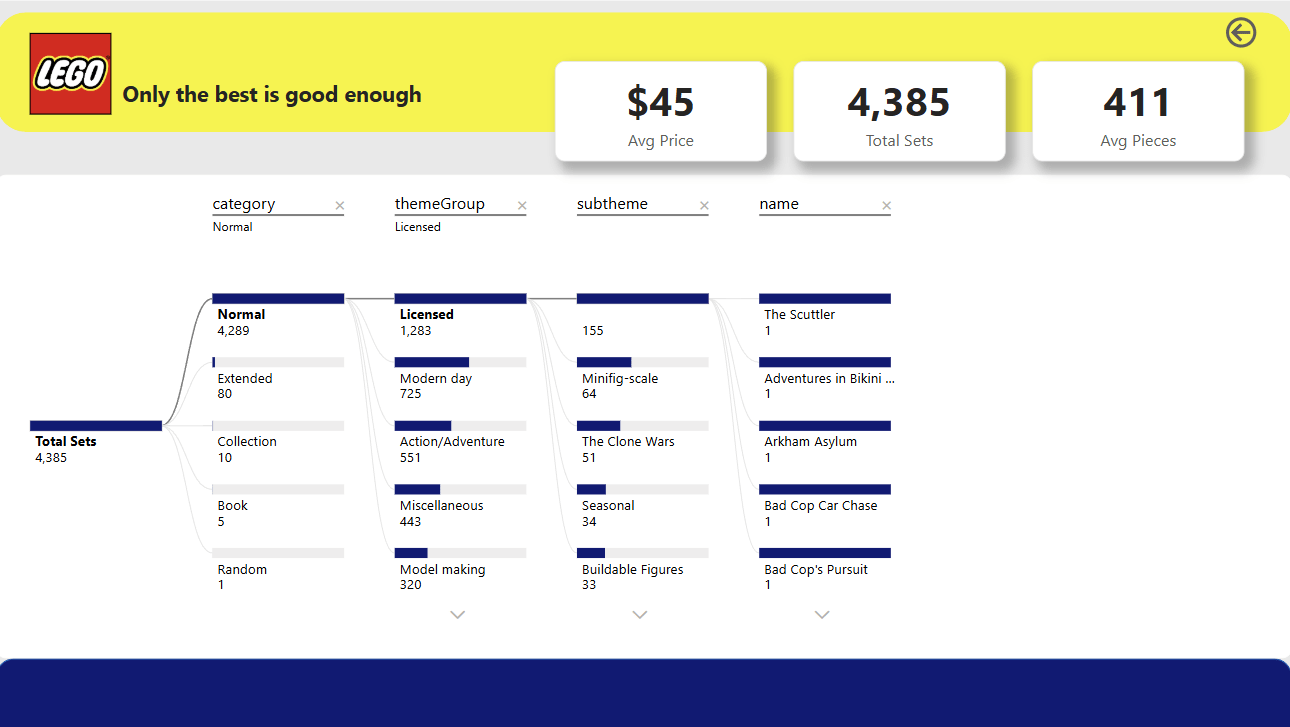
- Use of AI Visuals Like Decomposition Tree