In the realm of literature, numbers tell a compelling story of trends, preferences, and the ever-evolving landscape of readership. Our latest venture into the world of data analysis brings you a comprehensive Power BI dashboard that delves into the fascinating realm of book sales in 2019 and 2018.
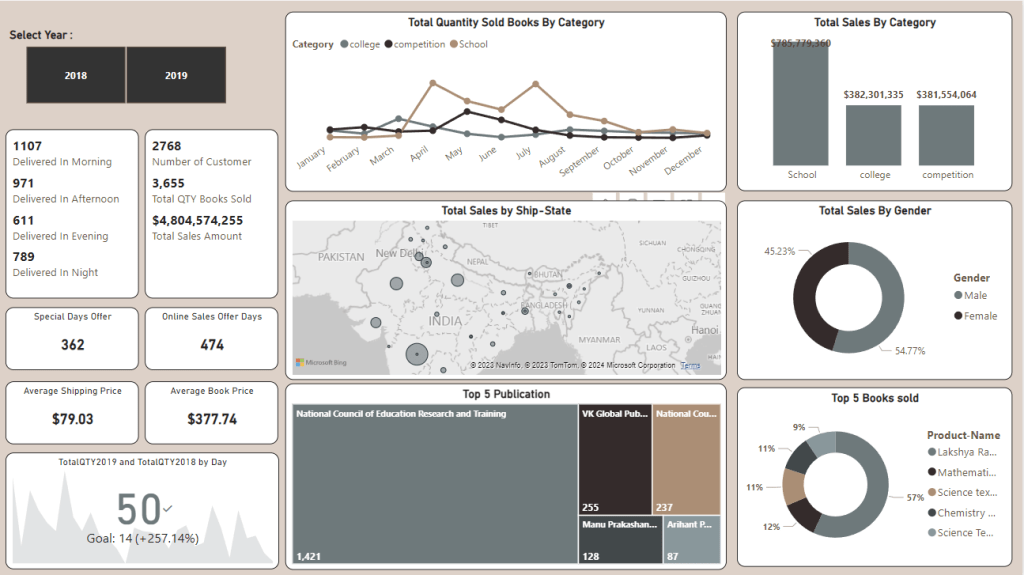
Curious about which genres dominated the market or how sales fluctuated throughout the years? Our meticulously crafted dashboard answers these questions and more. Dive into the data-driven narrative that unveils the patterns and preferences shaping the literary industry. Embark on a journey through the pages of data that narrate the story of book sales in 2019 and 2018. Our Power BI dashboard is more than analytics; it’s a portal to understanding the heartbeat of the literary world.